
Parallel faceted imaging in radio interferometry via proximal splitting (Faceted HyperSARA): when precision meets scalability
Published in arXiv, 2020
Abstract
Upcoming radio interferometers are aiming to image the sky at new levels of resolution and sensitivity, with wide-band image cubes reaching close to the Petabyte scale for SKA. Modern proximal optimization algorithms have shown a potential to significantly outperform CLEAN thanks to their ability to inject complex image models to regularize the inverse problem for image formation from visibility data. They were also shown to be scalable to large data volumes thanks to a splitting functionality enabling the decomposition of data into blocks, for parallel processing of block-specific data-fidelity terms of the objective function. In this work, the splitting functionality is further exploited to decompose the image cube into spatio-spectral facets, and enable parallel processing of facet-specific regularization terms in the objective. The resulting Faceted HyperSARA algorithm is implemented in MATLAB (code available on GitHub). Simulation results on synthetic image cubes confirm that faceting can provide a major increase in scalability at no cost in imaging quality. A proof-of-concept reconstruction of a 15 GB image of Cyg A from 7.4 GB of VLA data, utilizing 496 CPU cores on a HPC system for 68 hours, confirms both scalability and a quantum jump in imaging quality from CLEAN. Assuming slow spectral slope of Cyg A, we also demonstrate that Faceted HyperSARA can be combined with a dimensionality reduction technique, enabling utilizing only 31 CPU cores for 142 hours to form the Cyg A image from the same data, while preserving reconstruction quality. Cyg A reconstructed cubes are available online.
Highlights
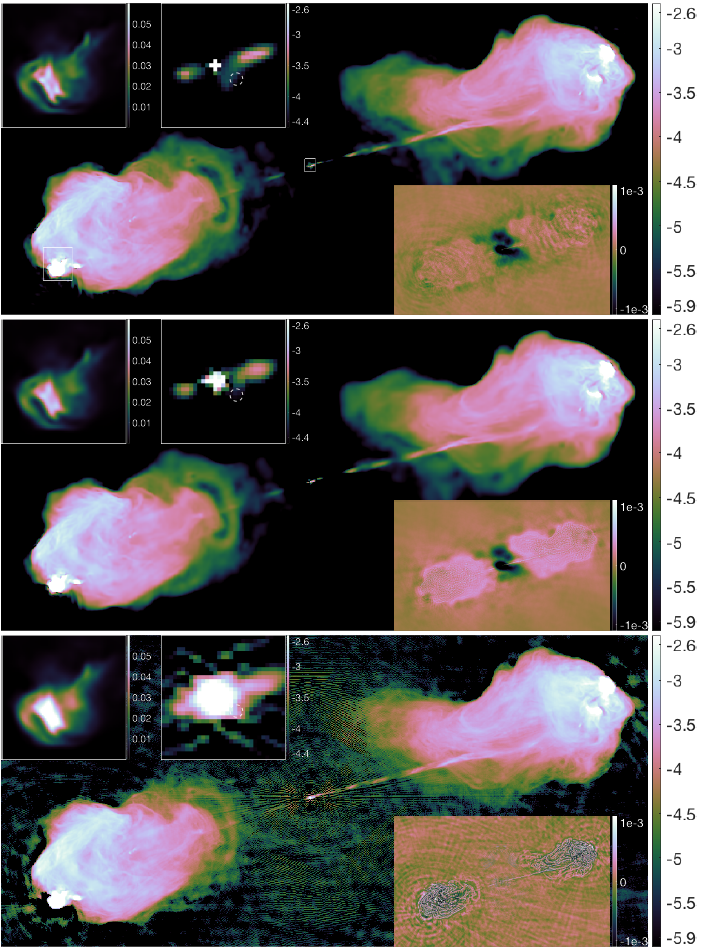
A proof-of-concept reconstruction of radio galaxy Cyg A from 7.4 GB VLA real data with the frequency range [3.979,8.019] GHz, centered at [RA, Dec] = [19:59:28.356, 40:44:2.07] confirms both scalability and a quantum jump in imaging quality from CLEAN. From top to bottom: the respective estimated average model images of Faceted HyperSARA and SARA, and average restored image of JC-CLEAN. The full FoV images (log scale) are overlaid with the residual images (bottom right, linear scale) and zooms on selected regions in Cyg A (top left, log scale). These correspond to the west hotspot (left) and the inner core of Cyg A (right). Cyg A-2 location is highlighted with a white dashed circle.